AegisFlow
Distributed Systems / LLM Infrastructure | 2026

Deterministic reliability for non-deterministic AI systems.
Designed the microservice topology and all service contracts. Implemented all seven services, the shared aegis_core library (circuit breaker, Pydantic schemas, Prometheus metric definitions, structured logging), the full OpenTelemetry → Prometheus → Grafana → Tempo observability stack, the chaos-injection engine, and the three ADRs that document every infrastructure decision.
AegisFlow sits between your application and any LLM provider. Every model output passes through a 4-axis confidence scorer (structural validity + semantic grounding + validator critique + provider history) combined with a diminishing-returns anomaly penalty into a single [0, 1] score. Based on the score, the system accepts, repairs, retries, falls back, or rejects — without the calling application knowing any of it.
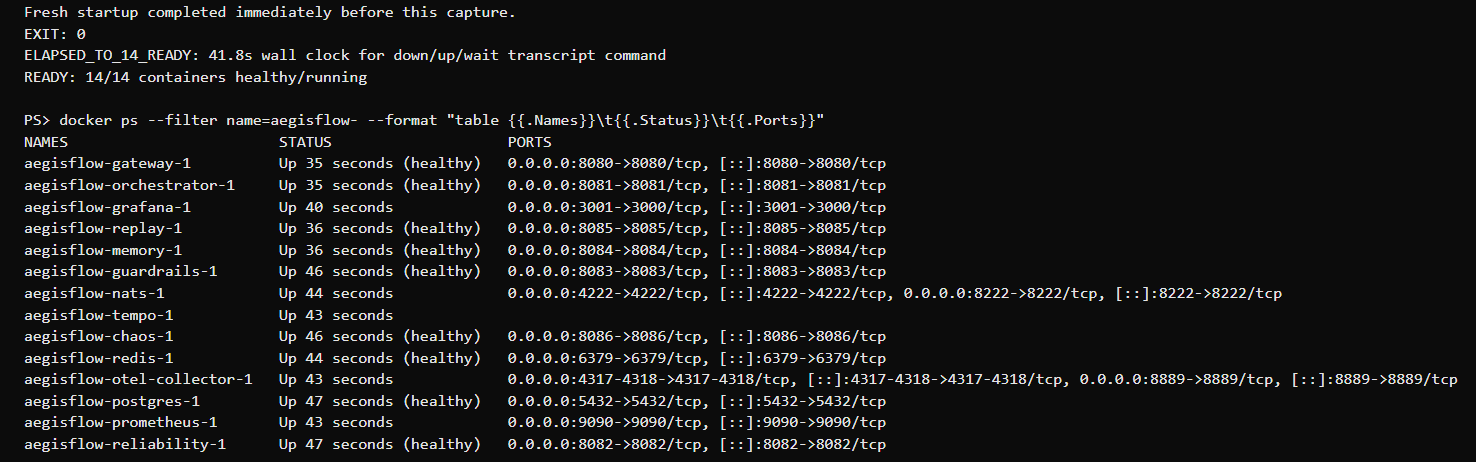
Full 14-container stack boots via make up (docker compose up -d --build), all services pass /healthz + /readyz, chaos scenarios verified end-to-end, Grafana dashboards rendering live data from the mock provider. Kubernetes manifests ship in infra/k8s/ with dev + prod overlays. Open-source under MIT at github.com/MustakimFS/aegisflow.
AegisFlow — reliability engineering for models that lie.
Seven microservices, a four-axis confidence model, and a chaos engine that stress-tests fallback paths before production traffic ever does. Every execution is event-sourced: given the same trace ID and a frozen model snapshot, the system reproduces the run bit-for-bit.
/healthz, /readyz, and Prometheus /metrics. Plus Postgres (pgvector), Redis, NATS, OTEL collector, Prometheus, Tempo, Grafana. make up brings up everything.structural_score (JSON parse) + grounding_score (token-Jaccard vs retrieved context) + critique_score (validator rubric) + historical_provider_score (rolling 5-min success rate), minus a diminishing-returns anomaly_penalty → 1 - exp(-0.5 * n_flags). Weights are workflow-configurable.GET /v1/replay/{trace_id} walks the full trace for post-incident debugging.LLMs are in production — reliability is still ad-hoc.
Traditional backend infrastructure assumes failures are categorical — a request either succeeded or it didn't. LLM systems break that assumption: a “successful” 200 response can still be wrong, malformed, or unsafe. SDKs had retry logic for rate limits but nothing for semantic failures. No open-source tool addressed the full surface: structural validation + grounding checks + provider failover + deterministic trace replay.
“Output parsers silently swallow malformed JSON and return None.”
“How do you handle hallucinations in production? — Top-voted answer: 'prompt harder and add a retry loop.'”
“Inconsistent or unexpected model outputs is the #1 production pain point for teams running LLMs at scale.”
“Unexpected content-type, truncated JSON mid-object, output structure changed across model versions.”
“Service meshes, retries, circuit breakers, and schema validators all assume failures are categorical — a request either succeeded or it didn't. LLM systems break that assumption.”
Five hard constraints, one architecture that survives them.
Five iterations, each one earned by a failure.
The monolith that couldn't be chaos-tested.
V1 was a single FastAPI app with reliability scoring, guardrails, and memory in-process. The immediate problem: you can't inject chaos into part of a monolith without affecting the whole thing. I wanted to test the guardrail repairer with 100% malformed JSON, but doing so in-process corrupted the reliability scorer's provider history stats. The split into microservices came directly from that failure — each service now gets its own chaos surface. ADR-0001 documents the decision.
The confidence formula that couldn't catch hallucinations.
First formula weighted all four components equally at 0.25. A model returning perfect JSON but hallucinating scored 0.75 — well above the 0.30 minimum threshold. Fix was structural: downweight history (0.10), add a separate anomaly penalty subtracted after the weighted sum, and use diminishing returns 1 - exp(-0.5 * n) so a single anomaly doesn't kill the score but five anomalies can't be overcome by perfect JSON. Final weights: 0.30·structural + 0.30·grounding + 0.20·critique + 0.10·history − 0.30·anomaly.
NATS JetStream over Postgres LISTEN/NOTIFY.
Started with Postgres LISTEN/NOTIFY for the event bus — already in the stack, one fewer service. Hit the wall when the replay service needed fan-out to multiple consumers simultaneously. LISTEN/NOTIFY doesn't survive consumer disconnects and has no replay semantics. NATS JetStream solved both in one binary with no ZooKeeper — at-least-once delivery plus hierarchical subject wildcards (workflow.*.completed). The full rationale is in ADR-0002:
1. Operational footprint. NATS runs as a single binary with no ZooKeeper / KRaft to manage. For a platform that targets self-hosting in customer K8s clusters, the lower op cost wins.
2. Latency. NATS pub-sub round-trip is sub-millisecond. Kafka's batching adds 5–50 ms even at low throughput.
3. Subjects vs. topics. NATS supports hierarchical wildcards (workflow.*.completed), which maps cleanly onto trace-driven fan-out.
4. Alternatives rejected: Apache Kafka (heavyweight, 5% of capability used), AWS SQS+SNS (vendor lock-in), Postgres LISTEN/NOTIFY (no fan-out, no disconnect survival).
Chaos that made testing impossible.
First chaos config had 30% failure probability across all providers. The happy path became unreachable — every test run hit at least one failure, making baselines impossible. Pulled back to conservative defaults: primary-blip 5%, json-corruption 10%, latency-spike 20% — all disabled by default and opt-in per test run via the chaos service API.
Discovering local-model JSON behavior empirically.
The assumption was that ```json fence wrapping was an edge case. In practice, ~40% of Qwen3 outputs and a similar fraction of DeepSeek R1 outputs arrived fenced. The prose prefix ("Here is the JSON:") was another surprise at 10–15%. Both are now first-order operations in the repair pipeline, not afterthoughts.
json.loads(raw) → JSONDecodeError → return None. Silent failure, no signal to caller.RepairResult(parsed=…, was_repaired=True, repairs=[…]). Caller knows exactly what was fixed.raise UpstreamTimeout → unhandled exception → 500. No recovery, no observability.The reliability loop — one request, seven services.
The data flow below is from ARCHITECTURE.md §3 “Happy path.” Nine steps, synchronous gRPC/HTTP on the request path, asynchronous NATS JetStream for fan-out, audit, replay, and chaos triggers.
{ "run_id": "01KT5PJWTS8PYS3RSKBM29849P", "status": "succeeded",
  "confidence": 0.379, "fallback_depth": 1, "retries": 0,
"trace_id": "703e552f7a2cc84580ff3eb9fc9dc35b" }| Service | Process model | Persistence | Scaling axis |
|---|---|---|---|
| gateway | stateless · async | Redis (rate-limit) | request rate |
| orchestrator | stateless · async | Postgres (runs) · NATS | concurrent workflows |
| reliability | stateless · CPU-bound | — (in-memory windows) | scoring throughput |
| guardrails | stateless · CPU-bound | — | validation throughput |
| memory | stateful read replicas | Postgres + pgvector · S3 | retrieval QPS |
| replay | stateful append-only | Postgres (event store) · S3 | event ingestion |
| chaos | stateless | Redis (active scenarios) | — |
confidence =
   w1 · structural_score       # JSON parse: 1.0 / 0.5 / 0.0
 + w2 · grounding_score        # token-Jaccard vs retrieved ctx
 + w3 · critique_score         # validator rubric [0,1]
 + w4 · historical_provider    # rolling 5-min success rate
 - w5 · anomaly_penalty        # 1 - exp(-0.5 * n_flags)

# Defaults (workflow-configurable):
#   w1=0.30  w2=0.30  w3=0.20  w4=0.10  w5=0.30

decision:
  ≥ 0.75  → ACCEPT
  ≥ 0.50  → REPAIR_AND_RETRY
  ≥ 0.30  → FALLBACK_PROVIDER
  < 0.30  → REJECT
CLOSED ─(failure_ratio > 0.5 in window)─► OPEN
OPEN ──(cooldown elapsed: 15s→30s→…→120s)──► HALF_OPEN
HALF_OPEN ─(probe success)─► CLOSED
HALF_OPEN ─(probe failure)─► OPEN (double cooldown)

# Failure = 5xx, timeout, connection error.
# Low-confidence outputs are NOT failures at this
# layer — they're handled by the reliability engine.

# Per-provider, per-model.
# Implemented in libs/aegis_core/circuit_breaker.py
aegisflow_workflow_duration_seconds{workflow,status}     # histogram
aegisflow_agent_invocations_total{agent,provider,outcome} # counter
aegisflow_reliability_confidence{workflow}                # histogram
aegisflow_circuit_state{provider,model}                   # gauge 0/1/2
aegisflow_retries_total{provider,reason}                  # counter
aegisflow_fallback_total{from_provider,to_provider}       # counter
aegisflow_tokens_total{provider,direction}                # counter
aegisflow_memory_recall_at_k{k}                           # histogram
aegisflow_chaos_injections_total{scenario} # counterclass FailureMode(StrEnum):
LATENCY = "latency" # inject N ms latency spike
TIMEOUT = "timeout" # drop the request on the floor
PROVIDER_5XX = "provider_5xx" # synthetic upstream failure
MALFORMED_JSON = "malformed_json" # wrap or truncate the output
HALLUCINATION = "hallucination" # valid shape, fabricated content
REFUSAL = "refusal" # 'I can't help with that' patternsWhat shipped — and what shipping means here.
Everything below is captured from the running stack — no mockups. The boot transcript, the Grafana dashboard, a real workflow response, and the chaos-driven fallback + guardrails repair, in order.
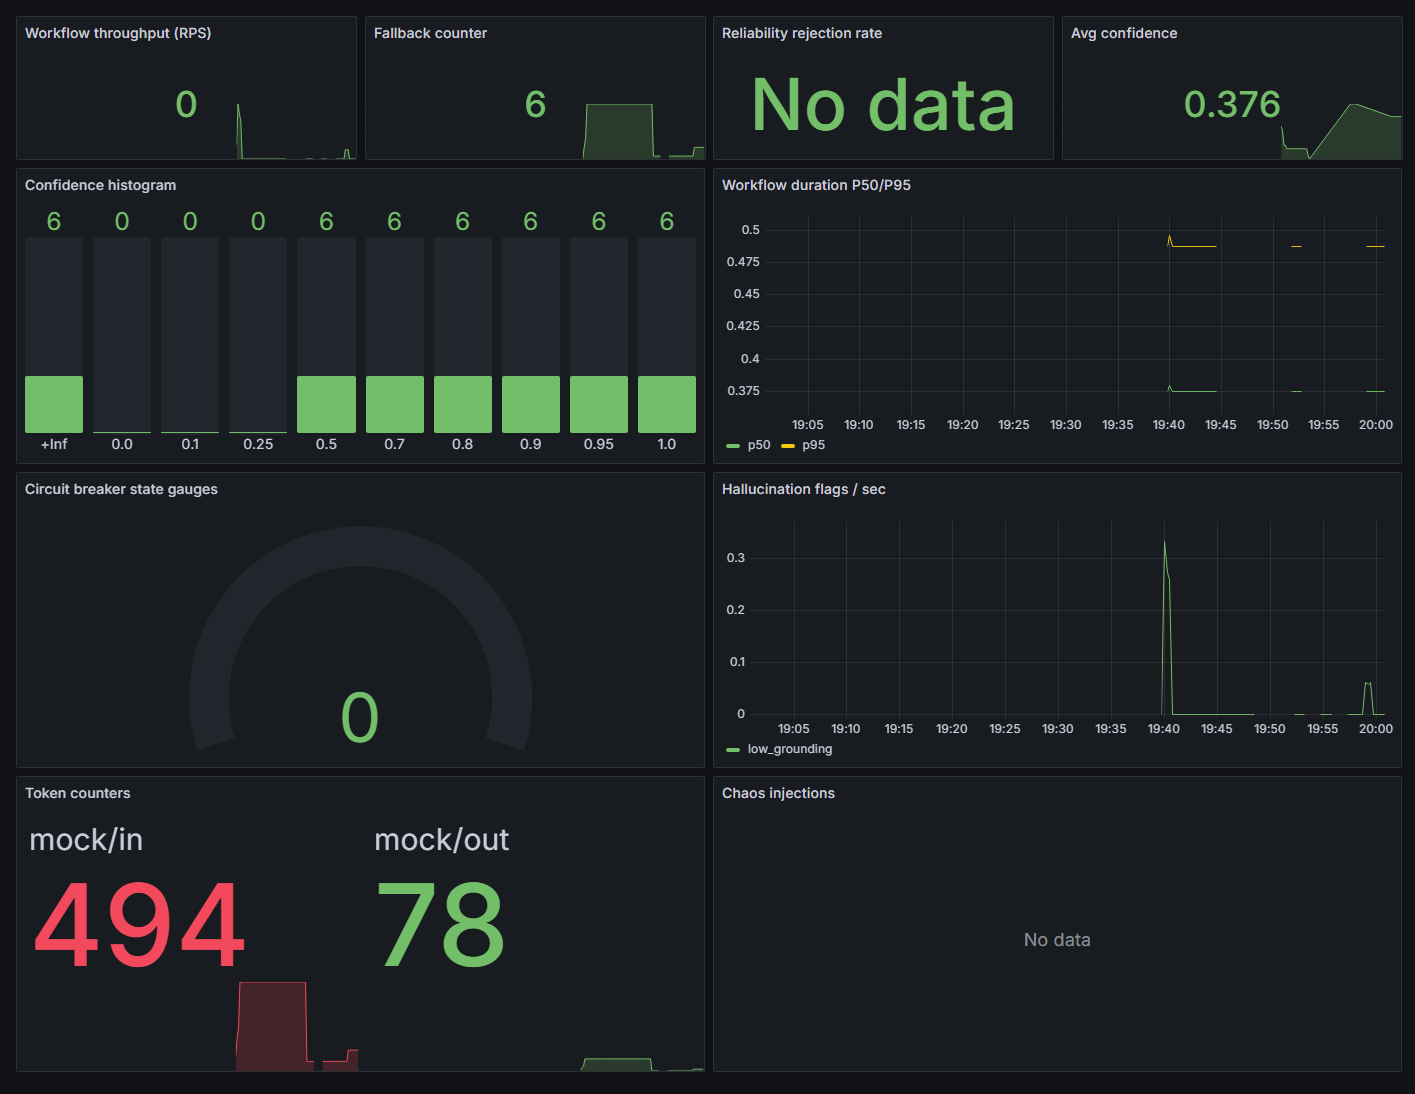
Every panel reads a real Prometheus metric: workflow throughput, fallback counter, reliability rejection rate, average + histogram of confidence, P50/P95 duration, circuit-breaker state gauge, hallucination flags/sec, and token counters. Avg confidence sits at 0.376 here because the demo runs against the mock provider with chaos enabled — the system is doing exactly what it should: scoring low and falling back.
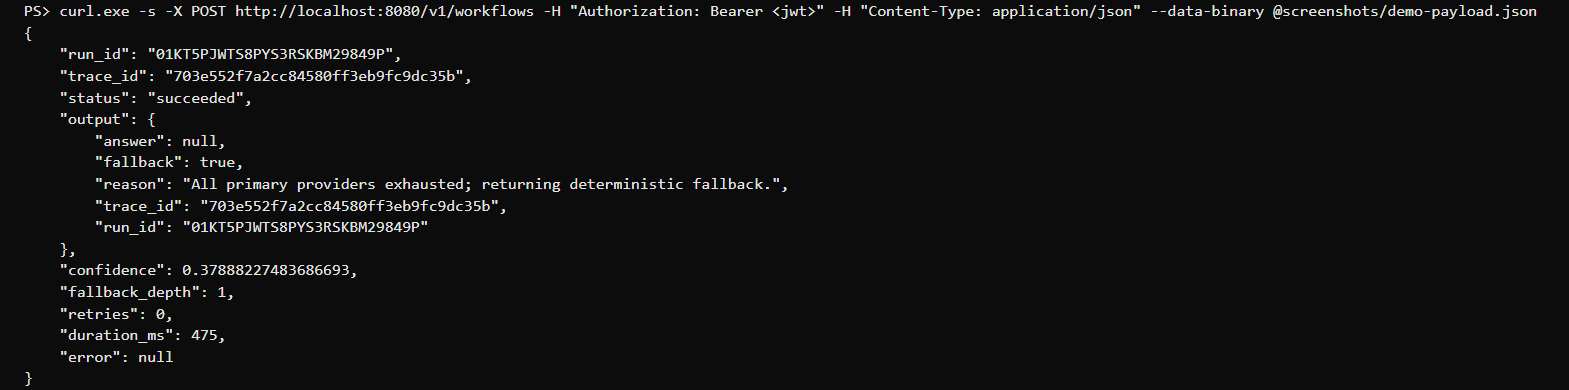
Real fields, real values. confidence: 0.379 lands below the accept and retry thresholds, so the routing tree walks the fallback chain (fallback_depth: 1) and the orchestrator returns the deterministic rule-based fallback — “All primary providers exhausted; returning deterministic fallback.” The caller still gets a structured status: succeeded with a trace_id that keys straight into the replay event stream. No exception, no 500 — the failure is handled, not leaked.
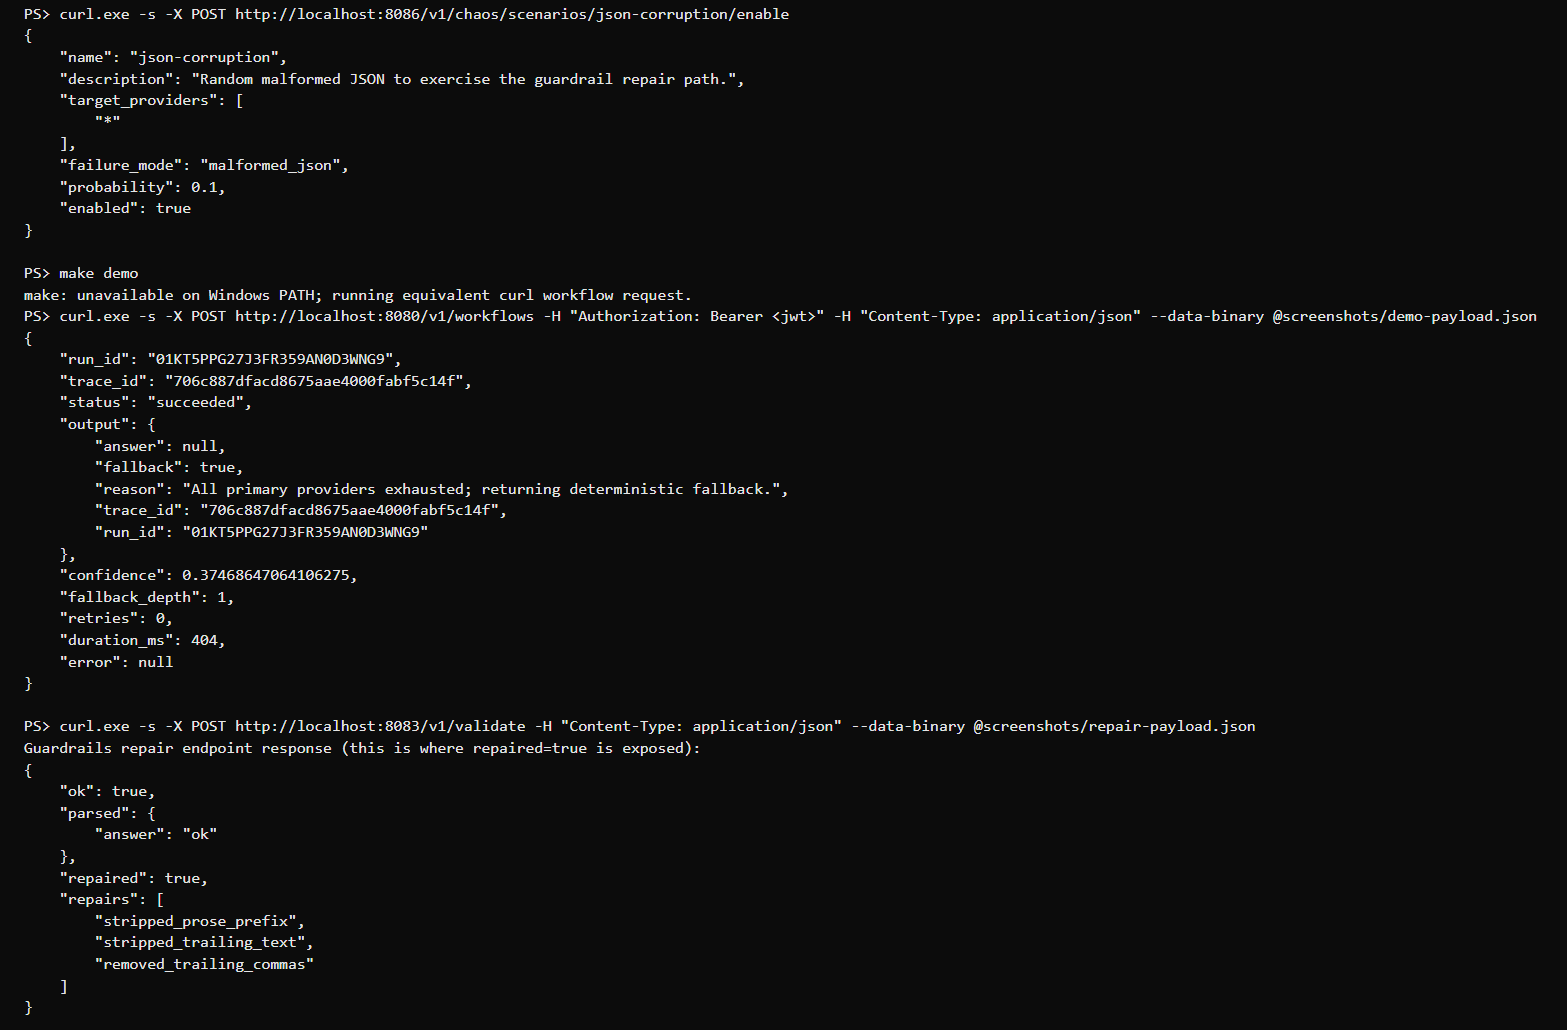
Structure over values. Enabling the json-corruption chaos scenario (probability 0.1, all providers) forces malformed output through the guardrails repair path. The /v1/validate endpoint returns repaired: true and lists every operation it applied — here stripped_prose_prefix, stripped_trailing_text, and removed_trailing_commas. The repairer only ever fixes syntax; if the structure still won't parse it returns a hard error rather than fabricating a payload.
Launch · honest framingThis is a portfolio project, open-source under MIT. No external users, no production traffic. Verified working on developer hardware, all services pass /healthz + /readyz, Grafana renders live metrics from the mock provider, and the chaos scenarios above were captured end-to-end. Saying so directly is stronger than inflating.
What worked, what I'd change.
Worked
Would change
Local Ollama models wrap JSON in markdown fences far more often than any documentation suggests. The assumption was "occasional edge case — maybe 5%." Empirically it was closer to 40% from Qwen3 and DeepSeek R1. The prose prefix ("Here is the JSON:") hit another 10–15%. The guardrails service isn't a last-resort fallback — it's a required post-processor for local models.