Back

Cascade

Graph Intelligence / ML | 2026
Cascade
https://localhost:3000/graph/markets
+

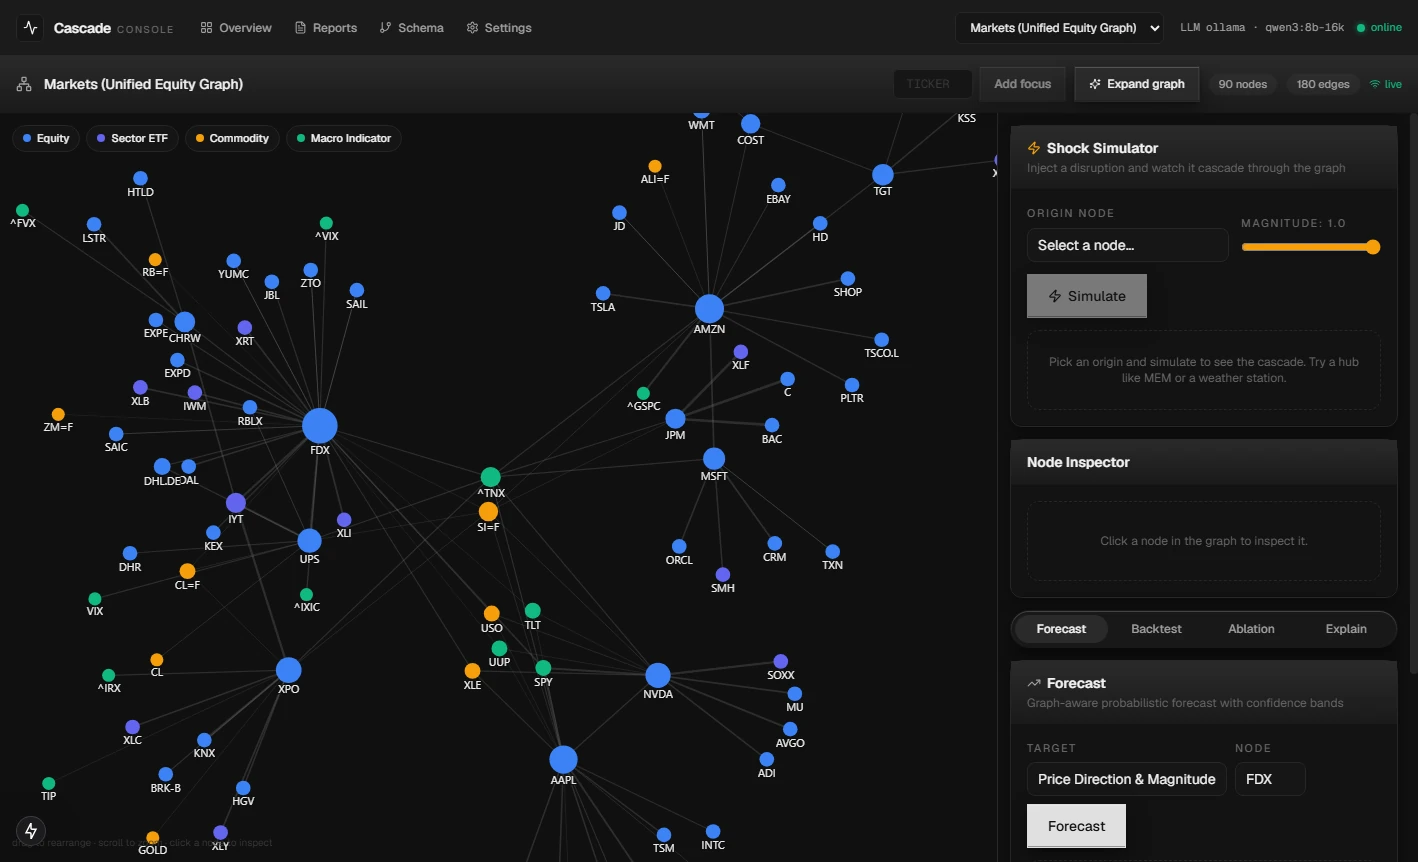
Cascade Console: the markets knowledge graph (force-directed influence graph), a shock simulator, and a graph-aware forecast panel
Overview

The graph grows itself. The forecaster stays honest.

My Role
Full-stack architect · sole engineer

Designed and built the entire stack: a schema-driven Python backend (FastAPI, LightGBM, a PyTorch GNN, NetworkX), a leak-free evaluation harness, and an interactive Next.js graph workspace with a force-directed canvas and background training jobs. Solo build.

Stack
Python · FastAPI · LightGBM · PyTorch · NetworkX · scikit-learn · Next.js · APScheduler · Ollama / NVIDIA NIM / Anthropic

Cascade is a domain-agnostic graph intelligence platform. Given any networked entity, it builds a living knowledge graph of everything that influences it, trains quantile forecasters on that graph, validates them out-of-sample, and writes a structured decision brief automatically. Every node type, edge type, prediction target, and UI panel is declared in YAML, so a new domain is a config file, not a code change.

Timeline
~4 weeks active · June 2026 · in development

The thesis is that a decision scientist's weekly workflow (refresh the influence model, re-fit forecasters, validate, brief stakeholders) is fully automatable if you build it right. Cascade ships three production worlds (an 86-node equity and macro market graph, a logistics hub network, and a stock-equity demo) and an autonomous analyst loop that runs the whole pipeline on a schedule. No public launch yet; built toward a decision-science portfolio review.

Highlights

Graph-aware forecasting, evaluated honestly.

Cascade built the infrastructure for leak-free, graph-aware time-series forecasting and automated the full decision-science loop: expand the influence graph, retrain, backtest, and write the brief, as a scheduled pipeline. The headline result is measured inside the disruption window where graph context is supposed to help, and reported exactly where it does not. Every design decision is captured across 22 architecture decision records.

7-19%
MAE reduction
logistics, h=1-4 · vs own-history baseline
210,475
Training bars
10-year lookback · 86 nodes
52 → 78%
Band coverage
raw → conformal-calibrated
Graph context earns its place, per domain.
On the logistics network, graph-structure features cut short-horizon error by 7-19% (h=1-4), decaying back to the baseline at longer horizons exactly as disruption-propagation theory predicts. On daily equities it does not: in 0 of 18 target evaluations did a graph configuration beat the own-history baseline. Graph structure helped logistics, not markets, and that negative result ships in the report instead of being hidden.
LightGBM over the GNN, on the evidence.
Head-to-head on logistics, gradient-boosted trees beat the temporal GNN (0.098 vs 0.151 MAE), so LightGBM stays the default and the GNN is the long-train path, not the headline. Every result runs through purged, embargoed time-series cross-validation.
Honest uncertainty, not false confidence.
Raw LightGBM q10/q90 bands were badly overconfident (52% coverage against an 80% target). Conformalized Quantile Regression with purged calibration slices brought that to 71-78% across multi-window evaluation. Forecasts now ship a band you can trust.
A workflow, not a demo.
The autonomous analyst loop wires every component into one scheduled pipeline (expand → retrain → backtest → forecast → brief → persist) so a dated decision brief appears with zero human intervention.
Context

Most forecasting demos quietly train on the future.

Logistics and decision-science teams run manual weekly cadences: someone pulls data from several sources, engineers features, fits a model, eyeballs a backtest, and writes a stakeholder brief. There is no standard tooling for it. Meanwhile most portfolio projects in this space commit the same sin: they shuffle time-series rows, test on data the model has effectively already seen, and quote accuracy numbers that collapse under honest evaluation. The gap is an automated, rigorous platform that tells the truth about what graphs actually help predict.

Lopez de Prado · Advances in Financial ML (2018)
Purge and embargo your folds, or your backtest is fiction.
The book that put purged k-fold CV into practitioners' vocabulary. It directly motivates Cascade's purged chronological split.
Kaggle M5 Forecasting · 42M rows (2020)
Gradient-boosted trees beat every deep model on tabular forecasting.
Public winning write-ups validate the GBM-first framing; the GNN stays the long-train path, not the default.
ML practitioner forums · time-series + overfitting
My LSTM crushes the backtest but dies live.
Dozens of threads where random splits on time-series silently leak the future. The default failure mode this project refuses to ship.
The Problem

Build it so the truth is cheaper than the lie.

Five constraints shaped every architectural decision. The hard one is the second: honest evaluation had to be the path of least resistance, or it would quietly erode the first time a number looked disappointing.

1
Zero domain hardcoding
Every entity (a stock, a hub, a macro indicator) is schema-defined. Adding a new world is a YAML file, never a Python change. The schema is the contract.
2
Honest evaluation, non-negotiable
No random train/test splits. All results use purged chronological splits; any claim of skill must clear a Pesaran-Timmermann significance test.
3
Free-tier data only
Public data sources for personal research, no paid API budget. Every edge weight is a measured trailing correlation, not a model assumption.
4
Simultaneous multi-entity access
The API serves concurrent worlds (stocks and freight at once) without one tab freezing another. Heavy CPU work runs in asyncio.to_thread with per-entity locks.
5
LLM provider portability
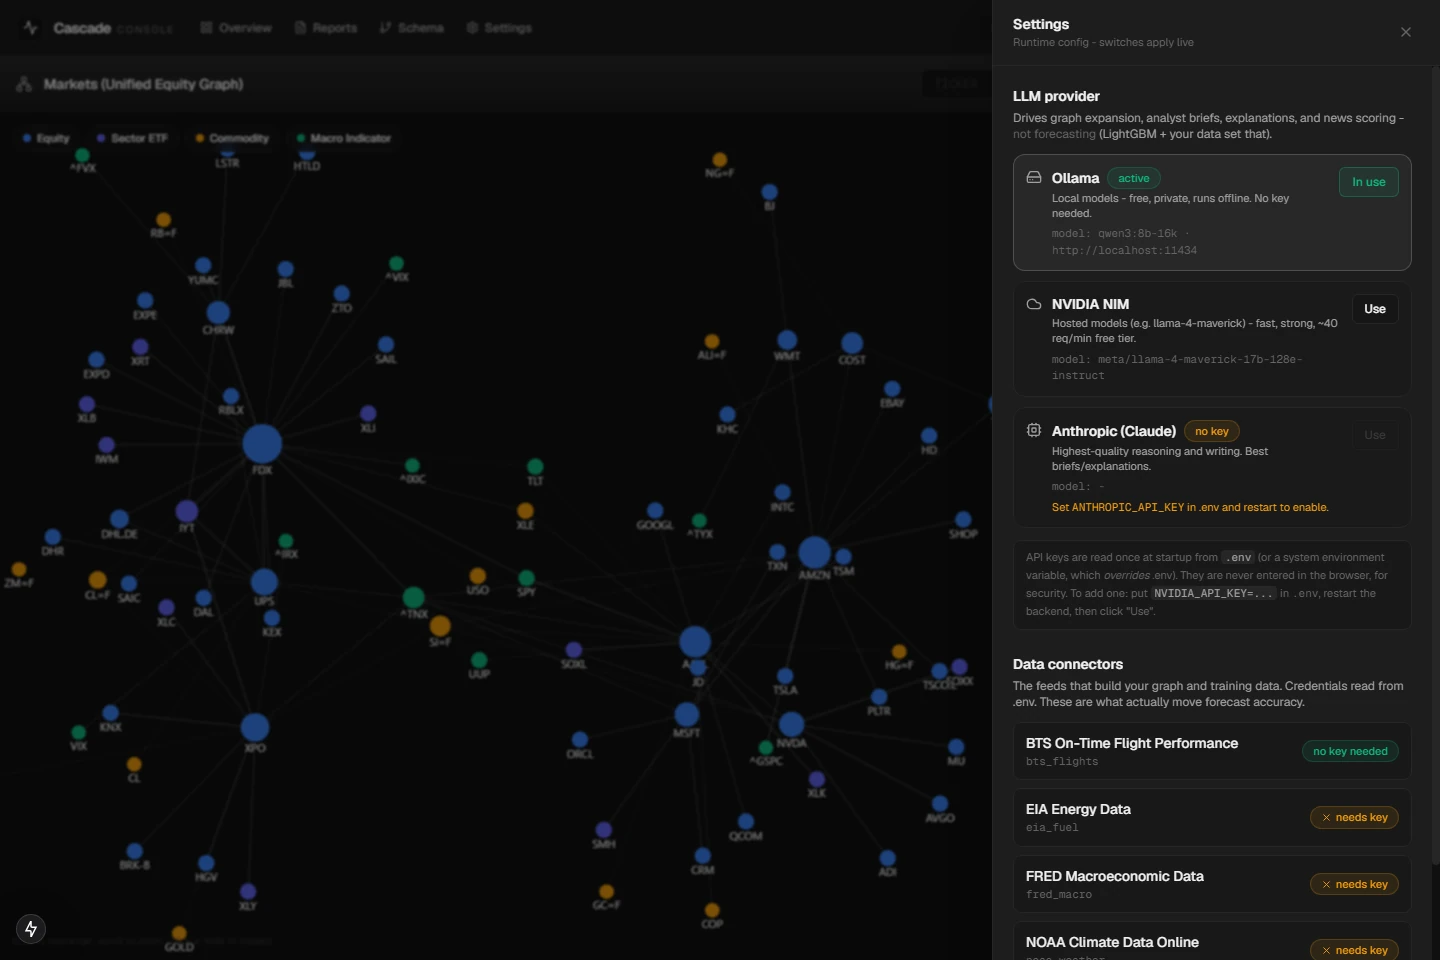
Keys live in the server environment, never the browser. The client swaps Ollama, NVIDIA NIM, and Anthropic at runtime without a restart.
Graph context earns its place.
If the graph does not improve the forecast in a domain, that result is reported, not buried. The honest finding is in the portfolio.
Automation must be auditable.
Every number in an LLM-written brief is derived from the backtester. The model narrates structured output; it cannot invent a figure.
Data, not compute, moves accuracy.
The architecture makes the 'more data' lever (longer history, more nodes, finer frequency) the easiest thing to pull.
Process

Four pivots, each one a result I didn't want.

V1

The suspiciously clean number

The first ablation used random row shuffles and reported an 11.4% MAE improvement on logistics. Too clean. The diagnosis: training on the future, testing on the past. Switching to purged chronological evaluation everywhere dropped it to an honest 4.4% overall (7-19% at short horizons). A weaker number, a far stronger story.

V2

Node2Vec memorized instead of generalizing

Adding 128-dim structural embeddings to the 11-node stock model measurably degraded out-of-sample performance on FDX. With that few nodes, the embeddings memorize node identity. Fix: a schema flag, use_embeddings: false for small graphs, on for the 60+ node logistics network where structural roles actually generalize.

V3

What does my trained model actually know?

Users training models had no visibility into what was trained. I added a model_info endpoint and a Model card in the UI showing family, profile, tree count, calibration method, coverage, and a top-feature importance chart. An invisible process became an inspectable artifact.

V4

From pieces to a pipeline

Every component existed in isolation: living graph, retrained models, backtester, LLM client. Wiring them into a scheduled analyst_loop (expand, retrain, backtest, forecast, brief, persist) is the moment the project went from an interesting demo to something that replaces a human workflow.

Calibration
Before
Raw q10/q90 bands at 52% coverage. Falsely tight, overconfident.
After
CQR-calibrated to 71-78% coverage. Honest uncertainty.
5.0DIAGRAM
Capability matrix
Before
Every entity showed Optimize, Shock, Seed, Expand. Clutter.
After
Schema-driven tabs: logistics shows Optimize, equities do not.
5.1DIAGRAM
Training depth
Before
42,945 bars, 2-year lookback. One regime.
After
210,475 bars, 10-year lookback across multiple regimes.
5.2DIAGRAM
Architecture

One pipeline, declared in YAML, run on a schedule.

Data flows in one direction: a YAML schema drives a feature builder over the graph, a quantile model, conformal calibration, a purged backtester, and finally the analyst loop that narrates the result. Swap the schema and the same pipeline retargets to a new domain.

Schema engine.
EntitySchema.from_dict turns a YAML file into node types, edge types, prediction targets, capabilities, and UI panels. Zero domain logic lives in Python.
Feature builder + graph context.
Per-node time series joined with graph-structure features and (above a size gate) Node2Vec embeddings. Edge weights are measured trailing correlations.
Forecast + calibrate.
LightGBM quantile models (q10/q50/q90) wrapped in Conformalized Quantile Regression, with a PyTorch temporal GNN as the long-train path.
Backtest + brief.
A purged chronological, multi-window backtester with PT significance, feeding an LLM that narrates strictly from structured output.
yamlschemas/logistics.yaml
+
# Adding a domain is config, not code.
entity: logistics_network
node_types: [hub, lane, carrier, weather, fuel]
edge_types: [feeds, delays, correlates]
target: delay_hours
use_embeddings: true   # 60+ nodes, roles generalize
capabilities: [forecast, backtest, optimize]
6.0Zero-hardcoding: a world is a YAML file.DIAGRAM
cascade@analyst: ~/core/analyst_loop.py
mustakim@portfolio:~$cascade run-cycle --world logistics_network
[1/6] expand graph 86 → 88 nodes, 167 → 171 edges
[2/6] retrain LightGBM quantile · 780 trees · 44.5s
[3/6] backtest purged · multi-window · PT p=0.03
[4/6] forecast h=1-4 · MAE -12.7% vs baseline
[5/6] brief narrated from structured output
[6/6] persist reports/2026-06-16-logistics.md ✓
6.1The autonomous analyst loop, one scheduled cycle.DIAGRAM
Final Designs

The workspace, end to end.

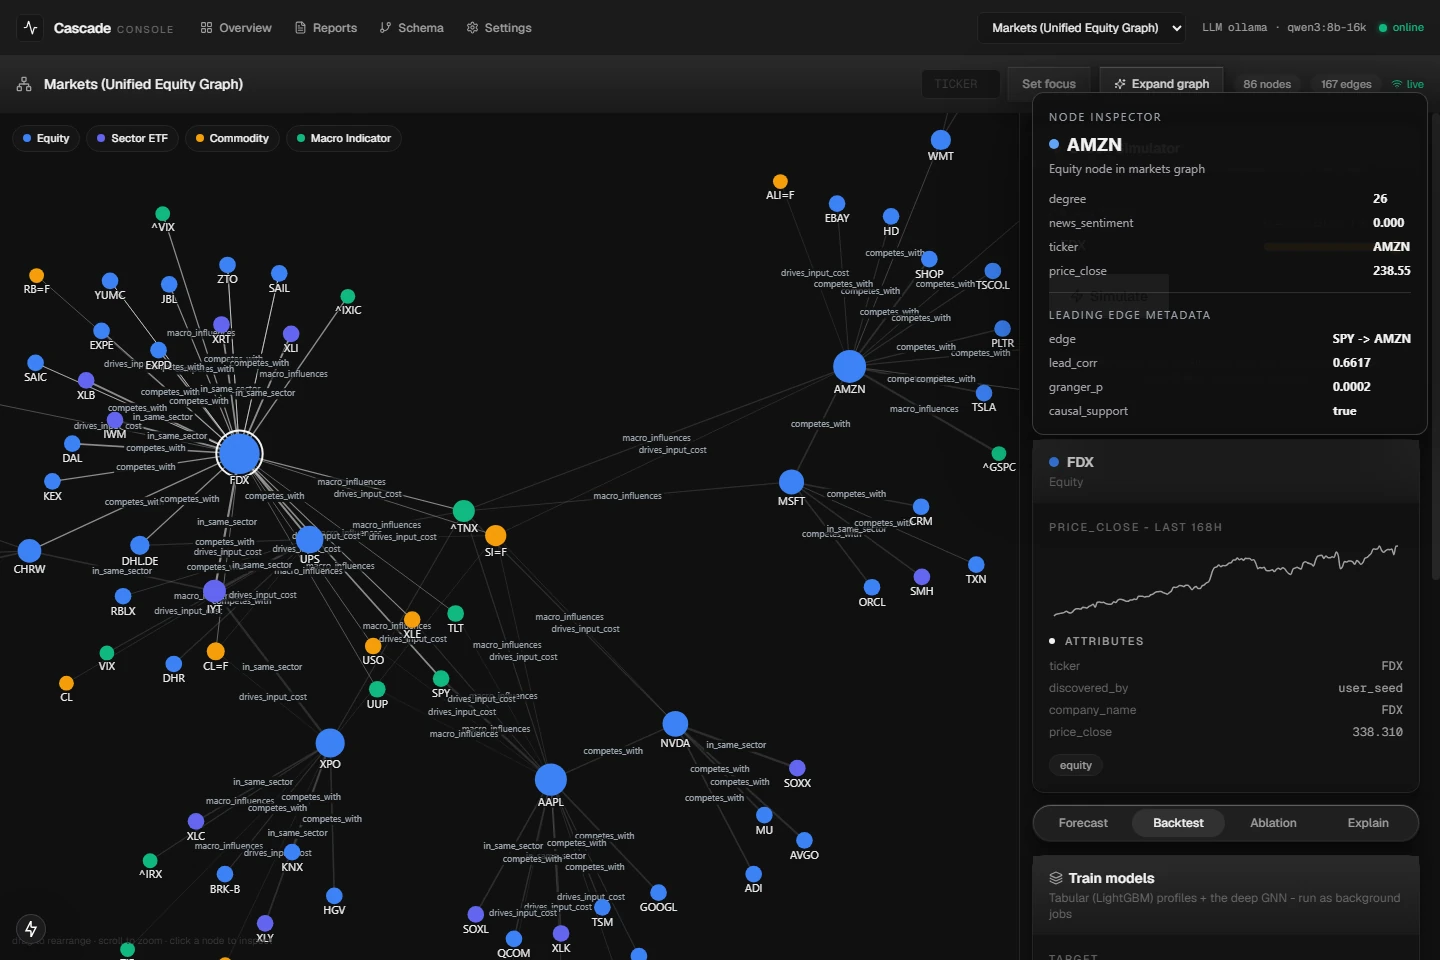
The live Cascade Console: the influence graph, the node inspector with causal edge metadata, the model and backtest panels, the autonomous analyst loop, and the provider settings that keep it portable.
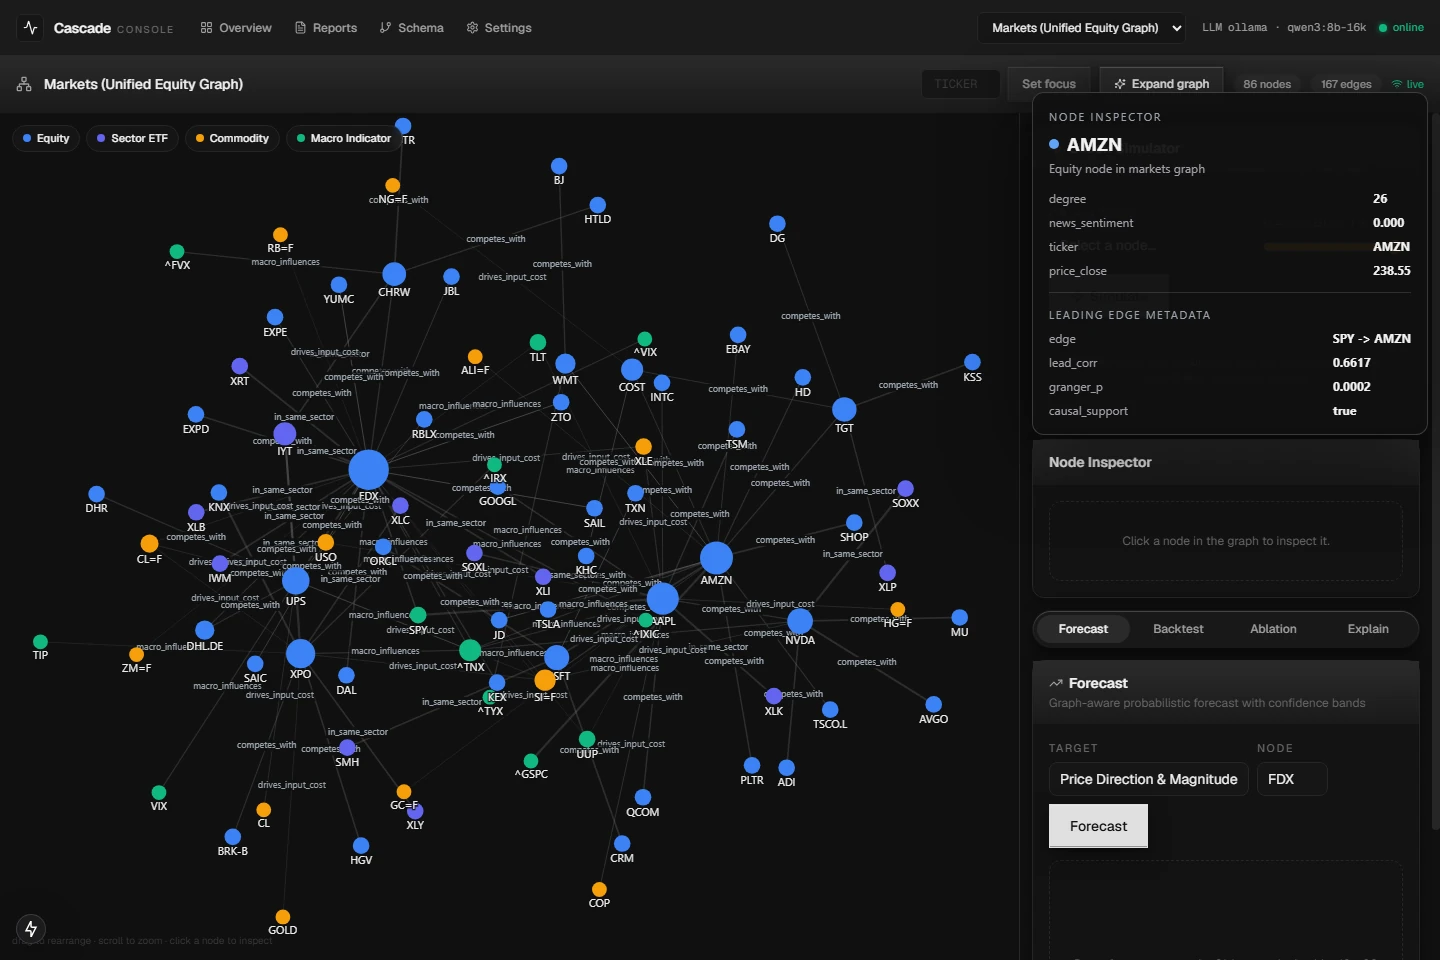
Markets knowledge graph with the AMZN node inspector open, showing degree, news sentiment, and leading-edge causal metadata (SPY to AMZN, granger_p 0.0002, causal_support true)
7.0Markets graph (86 nodes), AMZN inspector with leading-edge causal metadata.IMAGE
FDX node inspector with 168-hour price history and the backtest tab showing the LightGBM plus deep GNN training panel
7.1Node inspector, price history, and the LightGBM + GNN training panel.IMAGE
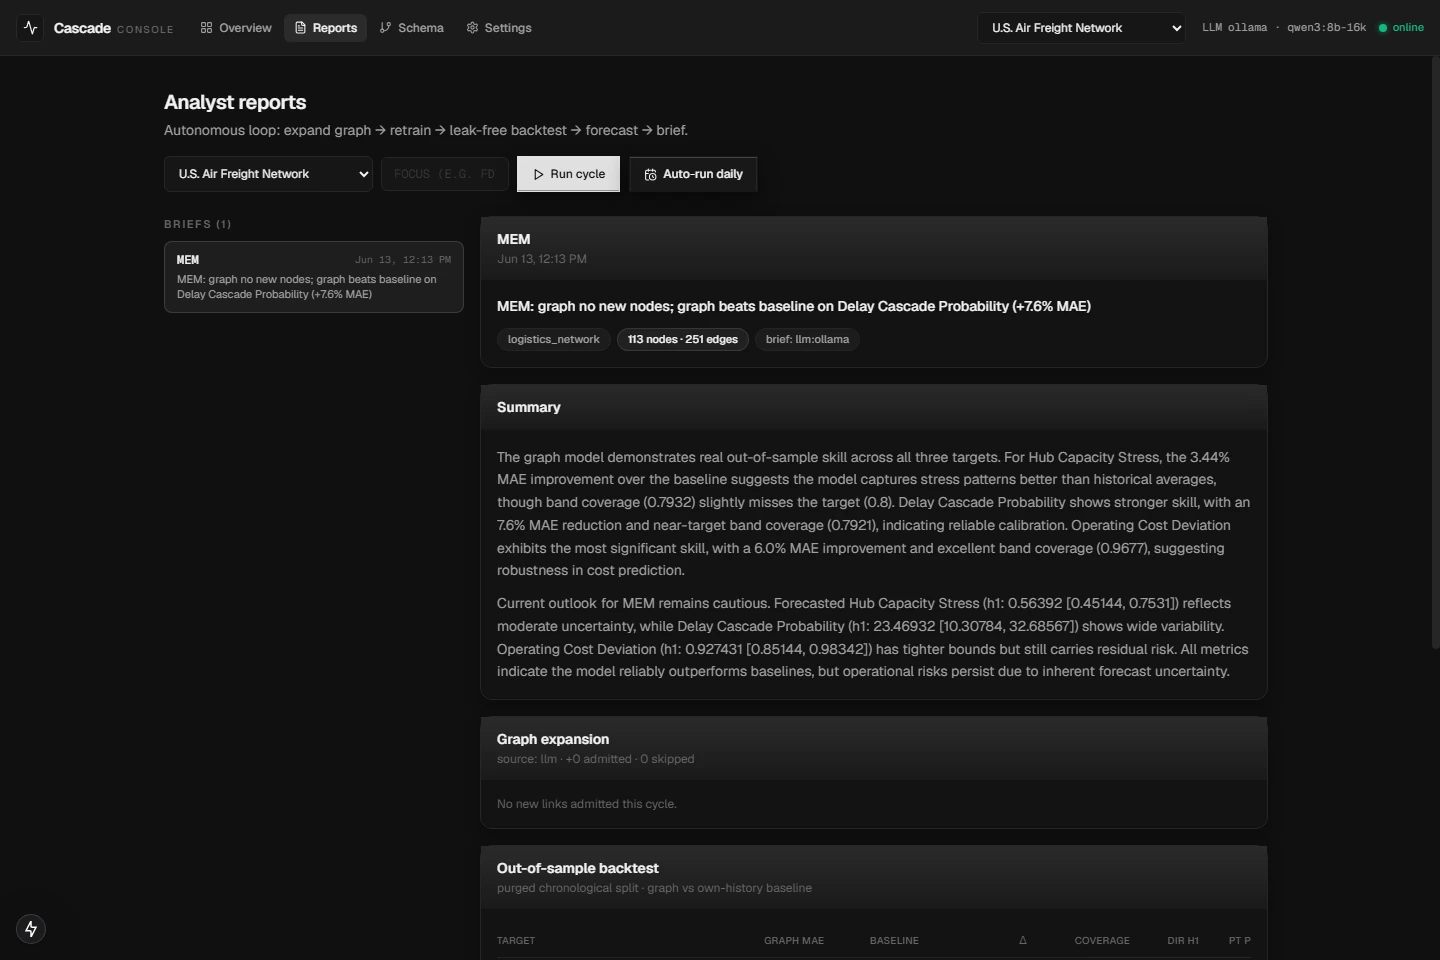
Analyst reports page: the autonomous expand-retrain-backtest-forecast-brief loop with a dated brief and an out-of-sample backtest table
7.2Autonomous analyst loop: dated brief, honest summary, out-of-sample backtest.IMAGE
Expanding the influence graph: new nodes and edges animate into the force-directed canvas
7.3Expanding the graph: new nodes and edges animate onto the force-directed canvas.IMAGE
Settings drawer with runtime LLM provider switching between Ollama, NVIDIA NIM, and Anthropic, and data connectors read from .env
7.4Runtime provider switching (Ollama / NVIDIA NIM / Anthropic); keys live in .env, never the browser.IMAGE
Retrospective

The negative result became the credibility.

What worked

Schema-driven everything
Putting all domain knowledge in YAML from day one is what kept the project coherent as it grew. Adding the third world took a config file and one restart, zero code.
Honest results as the story
The finding that the graph does not beat the baseline on daily equity direction became the differentiating claim: the backtests are leak-free enough to rediscover market efficiency, which is exactly what a trustworthy evaluation should find.
The autonomous analyst loop
Wiring existing pieces into a scheduled pipeline with a dated, persisted brief turned the project from an interesting demo into something that replaces a workflow.

What I'd do differently

Multi-window backtests from the start
A single-split result in one trend regime looked encouraging but was misleading. The honest multi-window evaluation was far flatter and took two iterations to retire the optimistic single-split view; on daily equity direction the result is statistically indistinguishable from chance, which is the correct finding to report rather than a headline.
Concurrency model up front
The asyncio.to_thread + per-entity lock design was retrofitted into six endpoints after concurrent tabs froze each other. It should have been in the first route.
Gate embeddings earlier
A use_embeddings: false default below ~40 nodes would have prevented the -9.8pp FDX regression entirely.
One surprise

The lead-lag feature shift made the forecast worse. The Granger engine correctly recovers planted structure on synthetic logistics data (including a 3-hour weather-to-delay lead), but using that discovered lag to shift each neighbor's signal dropped the logistics improvement from 4.21% to 2.64%. A node's composite signal averages attributes with different natural lags, so one global shift misaligns the rest. Causal discovery is valuable as edge metadata; exploiting it in predictions needs per-attribute lagged features, not a single composite shift. The gap between “causally discovered” and “predictively useful” was the biggest technical surprise of the project.